Key Capabilities
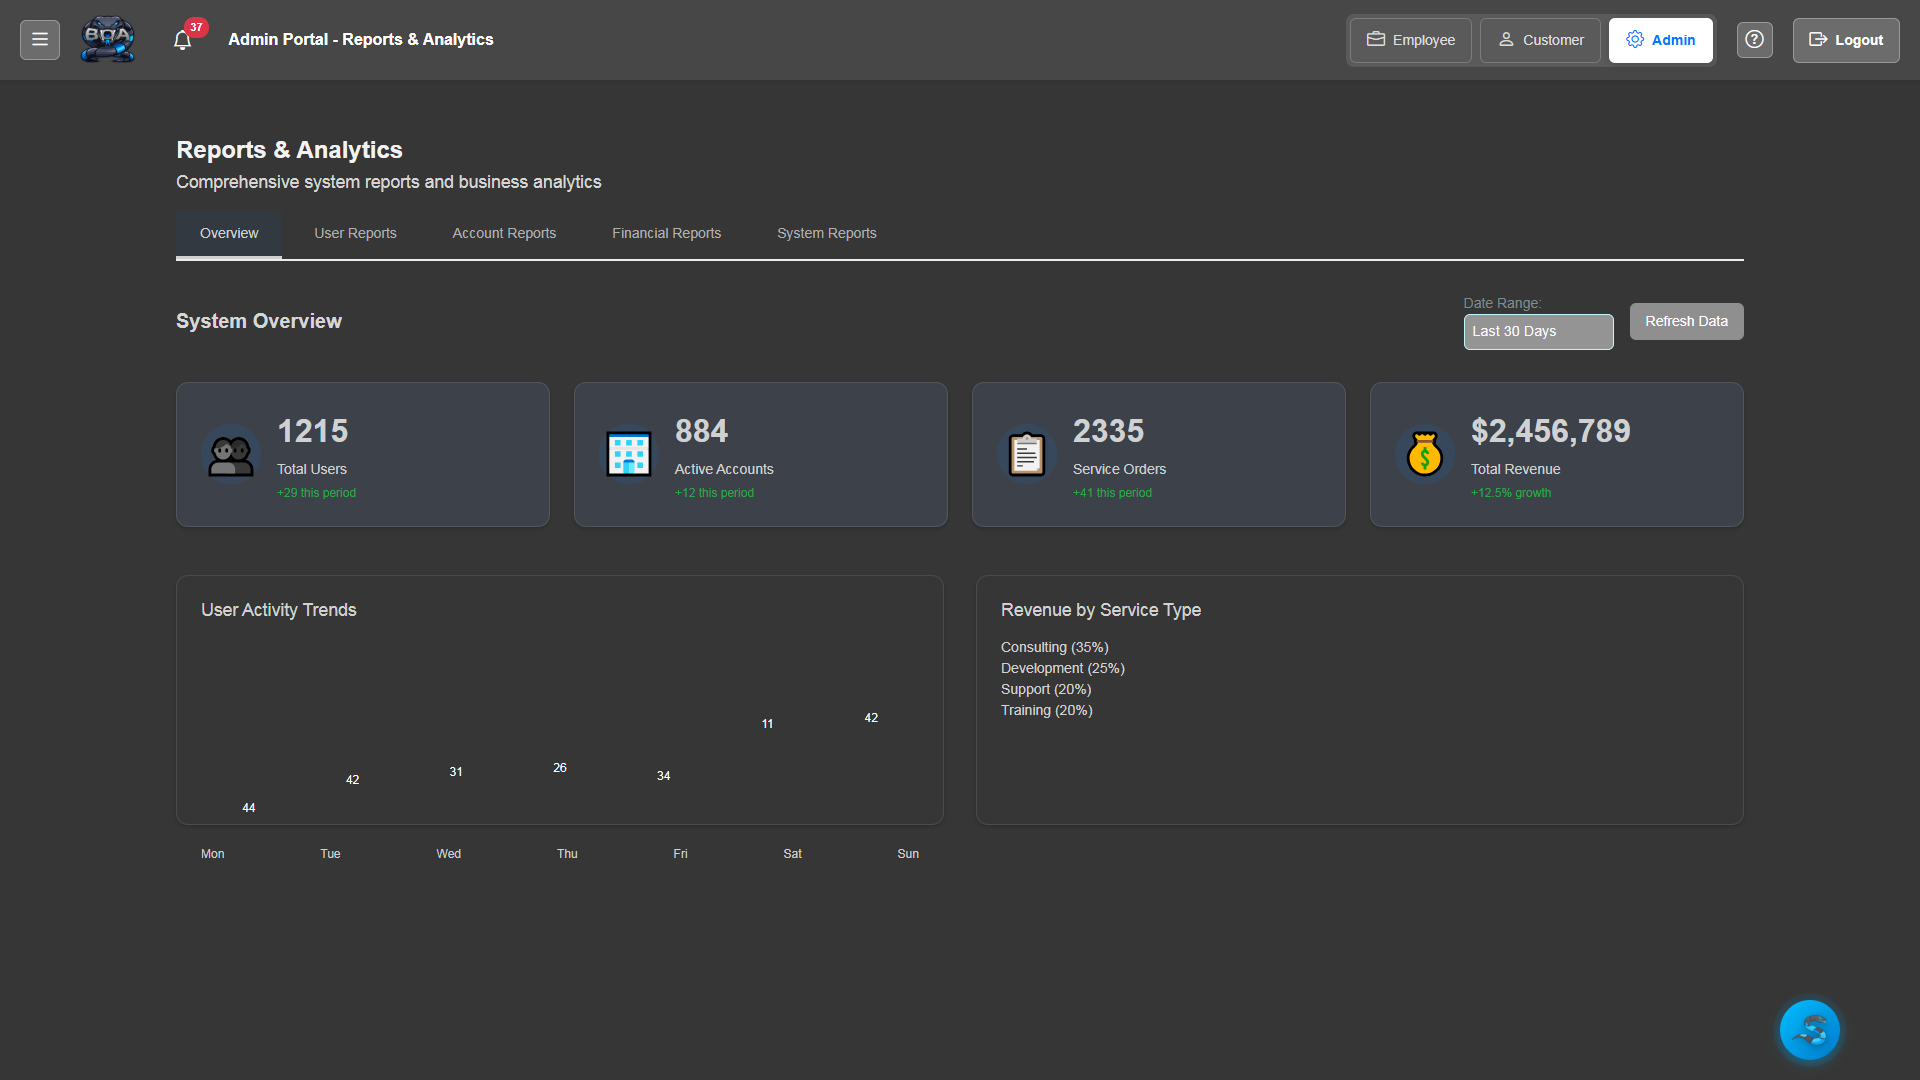
Interactive Dashboards
Real-time dashboards with charts, graphs, and summary tiles that give you an instant snapshot of business health. Revenue, open orders, technician workload, and inventory status are all visible at a glance.
- Revenue and profit trend charts with period comparisons
- Open order and service request count summaries
- Technician utilization and workload distribution graphs
- Inventory value and low-stock indicator tiles
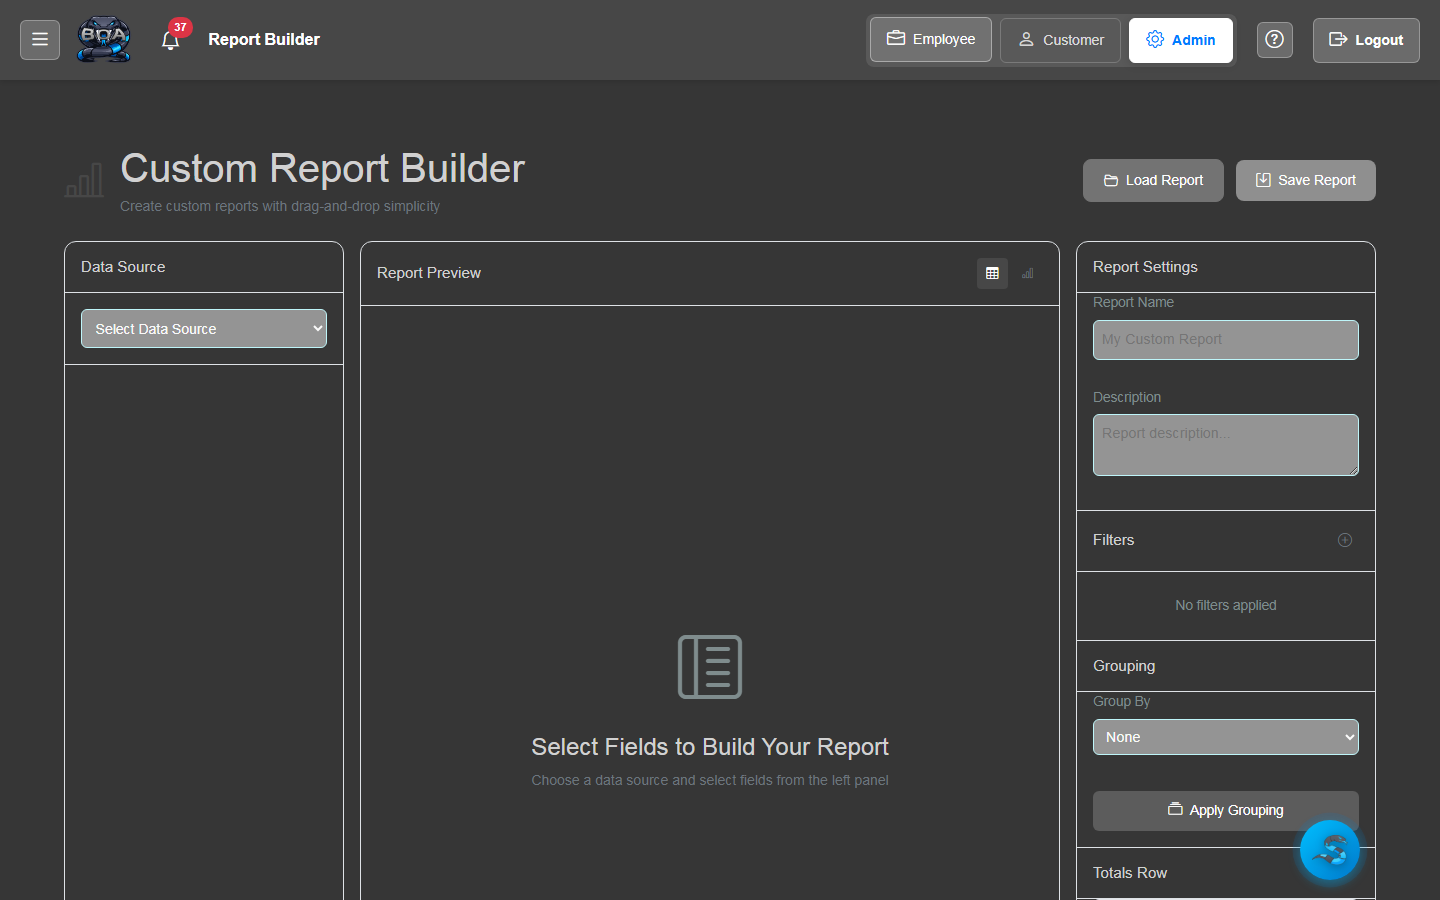
Report Builder
Create custom reports by selecting data sources, columns, filters, and grouping options. Save report definitions for repeated use and share them with your team for consistent reporting across the organization.
- Data source selection across all BOA modules
- Column picker with drag-and-drop ordering
- Multi-criteria filtering with AND/OR logic
- Saved report definitions for one-click re-execution

Pre-Built Reports
BOA ships with a library of pre-built reports covering the most common business metrics: revenue by customer, AR aging, service order volume, inventory valuation, contract renewals, and more.
- Revenue reports by customer, product, and time period
- Accounts receivable aging with 30/60/90/90+ day buckets
- Service order volume and completion rate analysis
- Inventory valuation and stock movement summaries
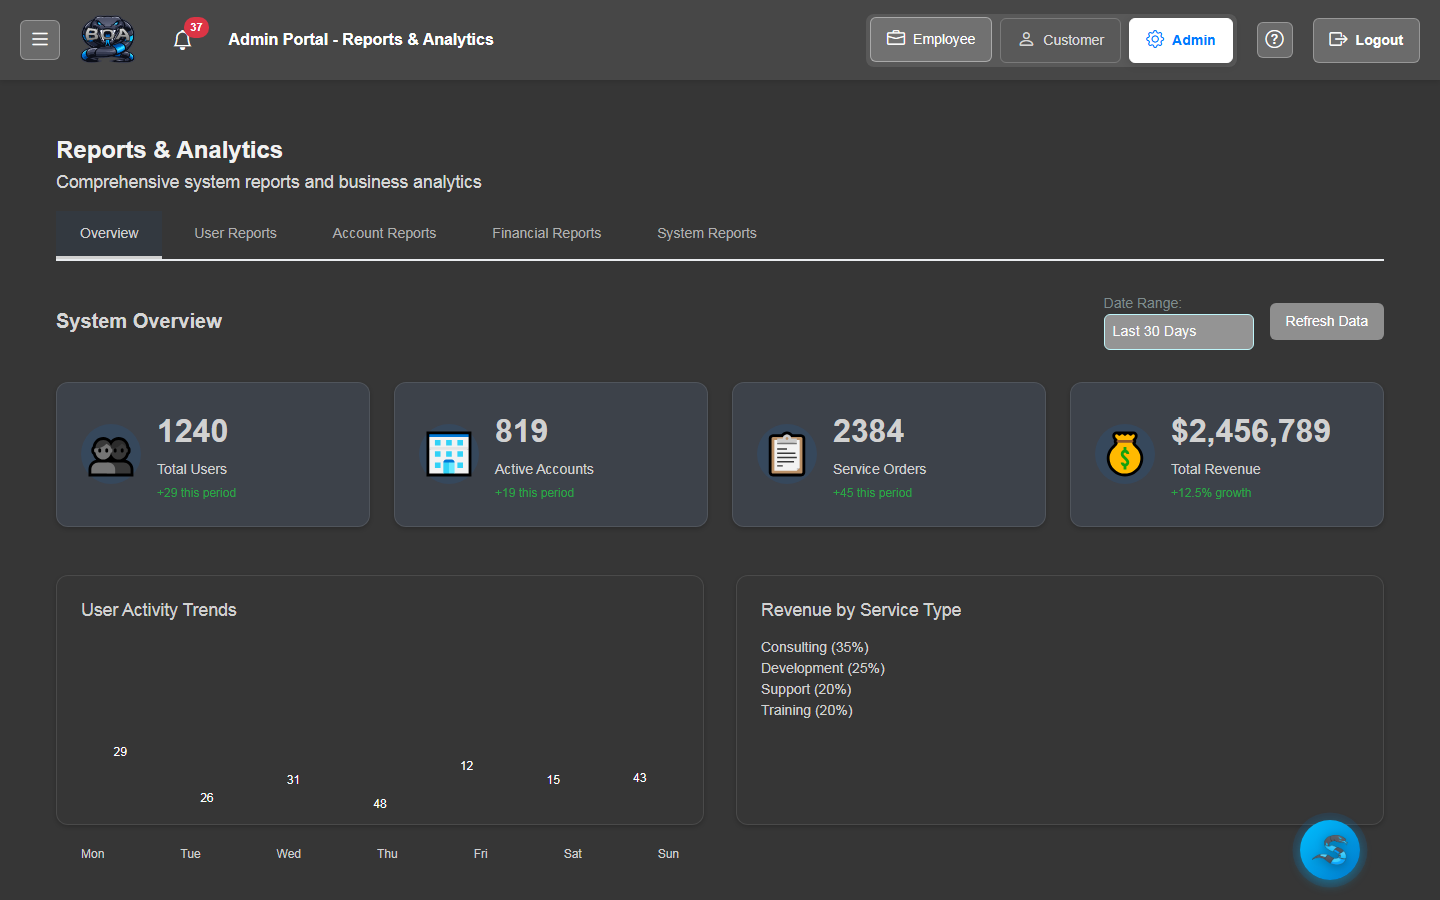
Date Range Filtering
Apply flexible date range filters to any report or dashboard. Use preset ranges like this week, this month, last quarter, or year-to-date — or define custom date ranges for precise analysis.
- Preset date ranges: today, this week, this month, this quarter, YTD
- Custom date range picker with calendar selection
- Period-over-period comparison for trend analysis
- Fiscal year support with configurable start month
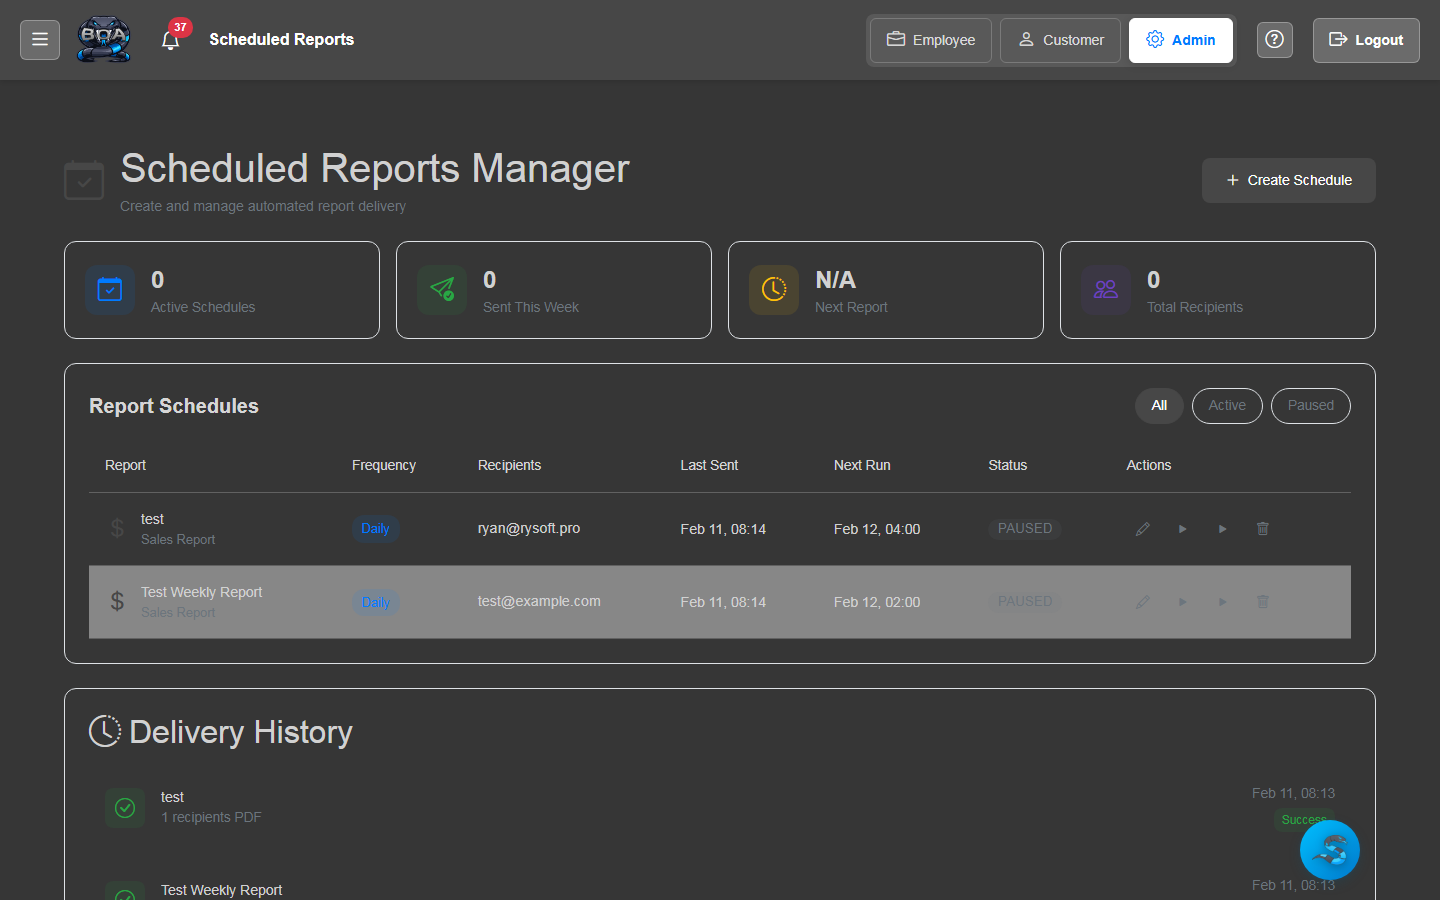
Scheduled Reports
Automate report delivery by scheduling reports to run on a recurring basis. Reports are generated and emailed as PDF or CSV attachments to your specified recipients on the schedule you define.
- Daily, weekly, monthly, and quarterly scheduling options
- Recipient list configuration with multiple email addresses
- Automatic PDF or CSV attachment generation
- Execution log showing delivery history and status
Export to PDF & CSV
Export any report or dashboard view to PDF for professional presentations or CSV for further analysis in spreadsheet applications. Exports include all applied filters and formatting.
- One-click PDF export with formatted layout and branding
- CSV export for spreadsheet analysis and data manipulation
- Export includes all active filters and column selections
- Batch export support for multiple reports at once